Install And Configure Nagios 4 On
1. CentOS, RHEL, Scientific Linux 6.5/6.4,
2. CentOS 7
3. Ubuntu 14.10
***************************************************************************
Install and Configure Nagios On CentOS, RHEL, Scientific Linux 6.5/6.4
Nagios is an open source
software that can be used for network and infrastructure monitoring.
Nagios will monitor servers, switches, applications and services. It
alerts the System Administrator when something went wrong and also
alerts back when the issues has been rectified.
With Nagios you can:
- Monitor your entire IT infrastructure.
– Identify problems before they occur.
– Know immediately when problems arise.
– Share availability data with stakeholders.hypothetical question
– Detect security breaches.
– Plan and budget for IT upgrades.
– Reduce downtime and business losses.
– Identify problems before they occur.
– Know immediately when problems arise.
– Share availability data with stakeholders.hypothetical question
– Detect security breaches.
– Plan and budget for IT upgrades.
– Reduce downtime and business losses.
Scenario
In this tutorial i am going to use two systems as mentioned below.
Nagios server:
Operating system : CentOS 6.5 minimal installation
IP Address       : 192.168.1.101/24
Nagios client:
Operating System : Ubuntu 13.04
IP Address       : 192.168.1.100/24
Prerequisites
Before
installing Nagios, make sure that you’ve a properly installed and
configured LAMP stack in your server. To install and configure LAMP
server, refer any one of the following links.
Also install the following prerequisites too. All commands should be run as root user.
# yum install gd gd-devel gcc glibc glibc-commonInstall Nagios
I tested this how-to on CentOS 6.5 minimal server, although it should work on all RHEL 6.x and its clones like CentOS 6.x and Scientific Linux 6.x.
Nagios will
not be found in CentOS official repositories, so let us add the EPEL
repository to install nagios. To add and enable EPEL repository, refer
the following link.
Next install nagios with all plug-ins and nagios agents(nrpe-agent) using command:
# yum install nagios*
Note:
It worked for me either if i keep SELINUX and iptables enable or
disable. All you need to do is allow the apache port through iptables as
shown below.
# vi /etc/sysconfig/iptables
Add the following line:
[...]
-A INPUT -m state --state NEW -m tcp -p tcp --dport 80 -j ACCEPT
[...]
Save and close the file. Restart iptables.
# service iptables restartConfigure Nagios
Add the admin mail address in the nagios contact file to receive alerts from nagios server. To do that edit file /etc/nagios/objects/contacts.cfg,
# vi /etc/nagios/objects/contacts.cfg
Find the following line and enter the email id:
[...]
email                           sk@unixmen.com ;
[...
Save and close the file. Then Edit file /etc/httpd/conf.d/nagios.conf,
# vi /etc/httpd/conf.d/nagios.conf
And
edit the following lines if you want to access nagios administrative
console from a particular IP series. Here i want to allow nagios
administrative access from 192.168.1.0/24 series only.
[...]
## Comment Lines 15 & 16 ##
#   Order allow,deny
#   Allow from all

## Uncomment and Change lines 17,18 & 19 as shown below ##
Order deny,allow
Deny from all
Allow from 127.0.0.1 192.168.1.0/24
[...]
Set nagiosadmin password
# htpasswd /etc/nagios/passwd nagiosadmin
New password:
Re-type new password:
Updating password for user nagiosadmin
Start nagios and httpd services and let them to start automatically on every boot.
# service nagios start
# service httpd start
# chkconfig nagios on
# chkconfig httpd on
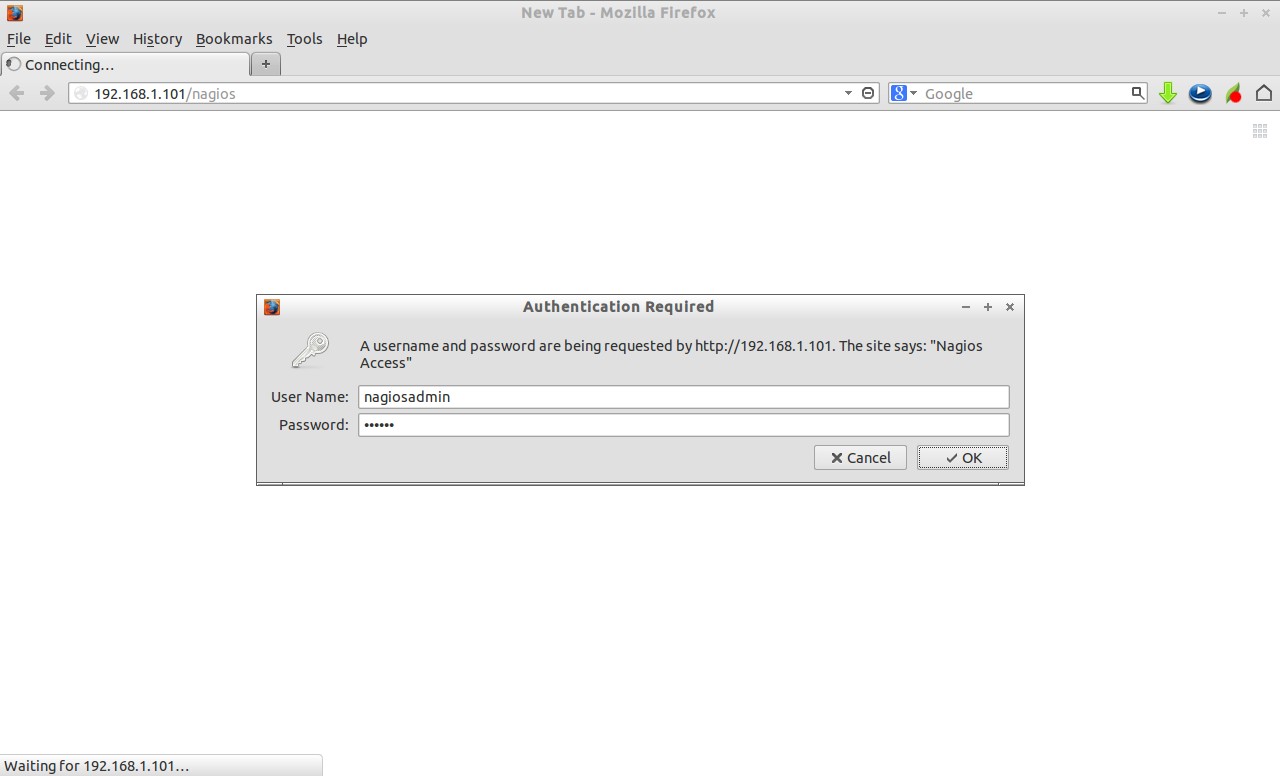
Access Nagios admin console
Open nagios administrator console with URL http://nagios-server-ip/nagios and enter the username as nagiosadmin and its password which we created in the earlier steps.
 This is how Nagios administrative console looks:
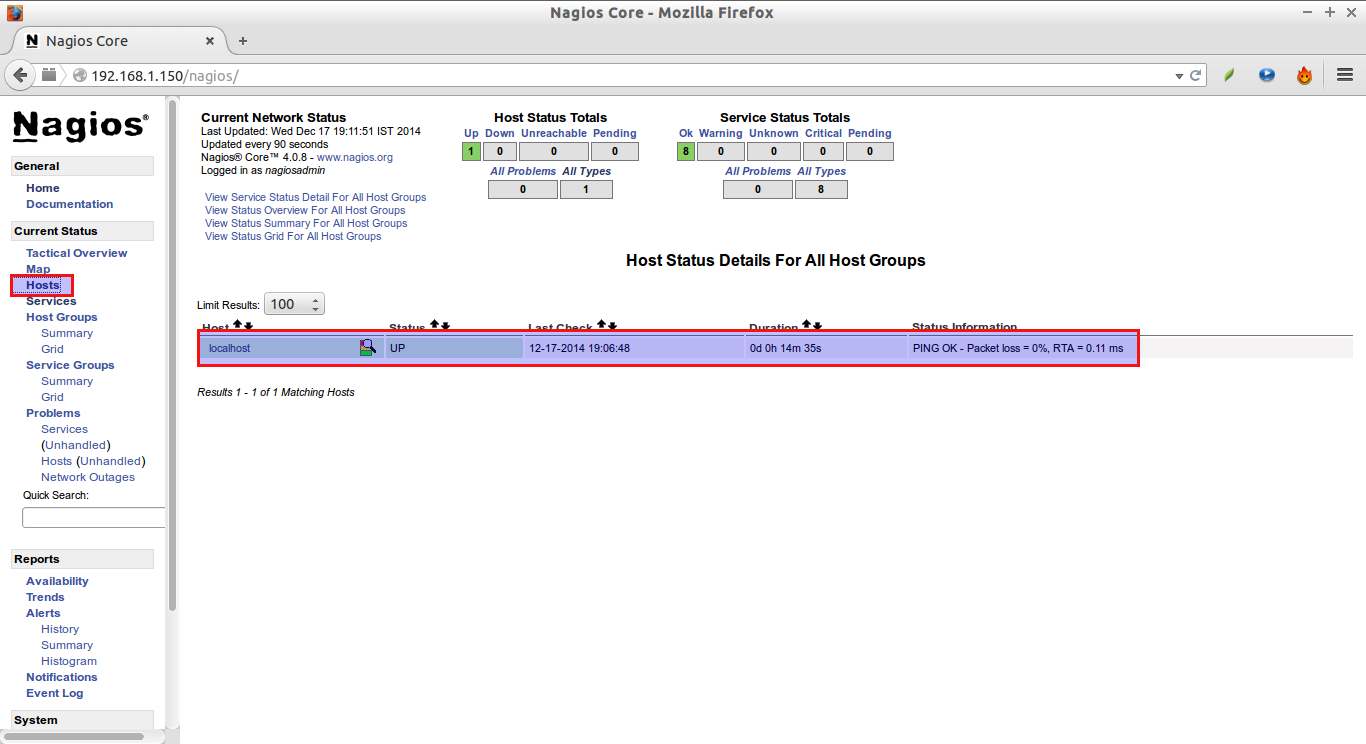
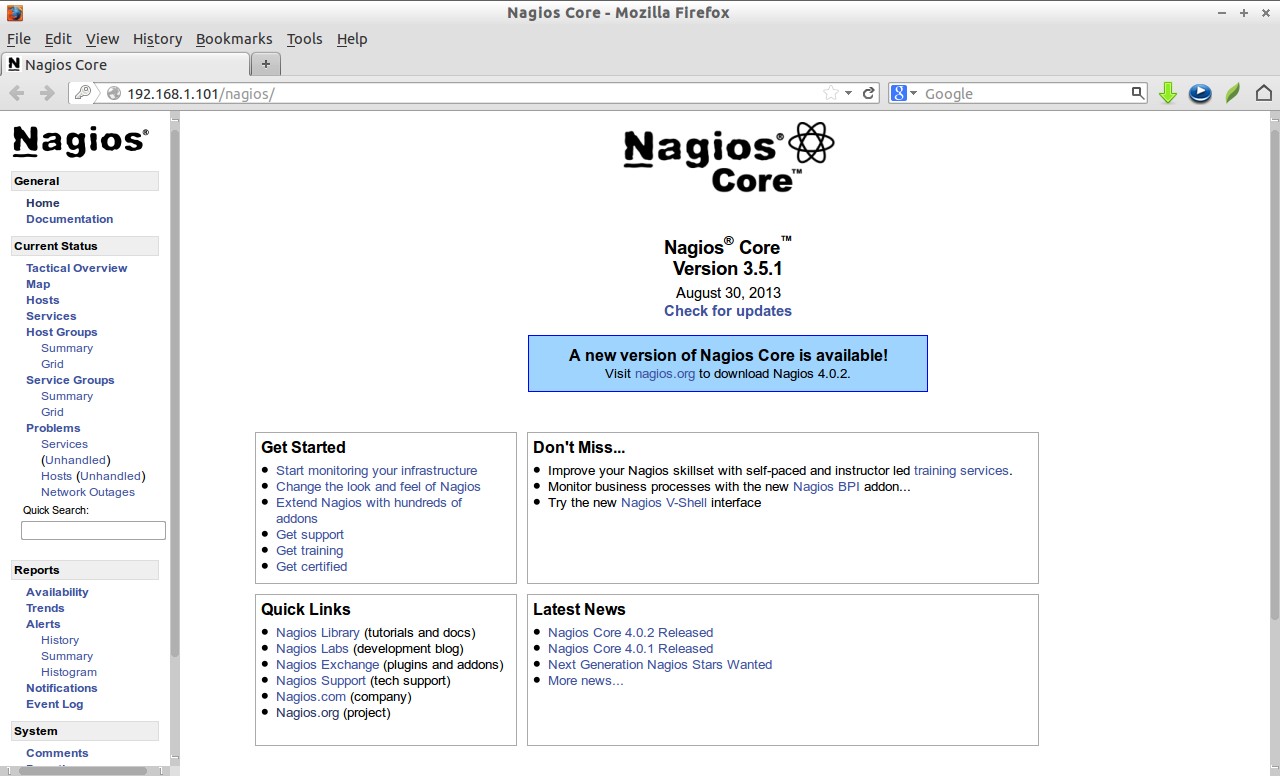 Click on the “Hosts”
section in the left pane of the console. You will see the no of hosts
to be monitored by Nagios server. Initially, the nagios server
(localhost) itself will only be monitored.
Click on the “Hosts”
section in the left pane of the console. You will see the no of hosts
to be monitored by Nagios server. Initially, the nagios server
(localhost) itself will only be monitored. Click on the monitoring host to display more details:
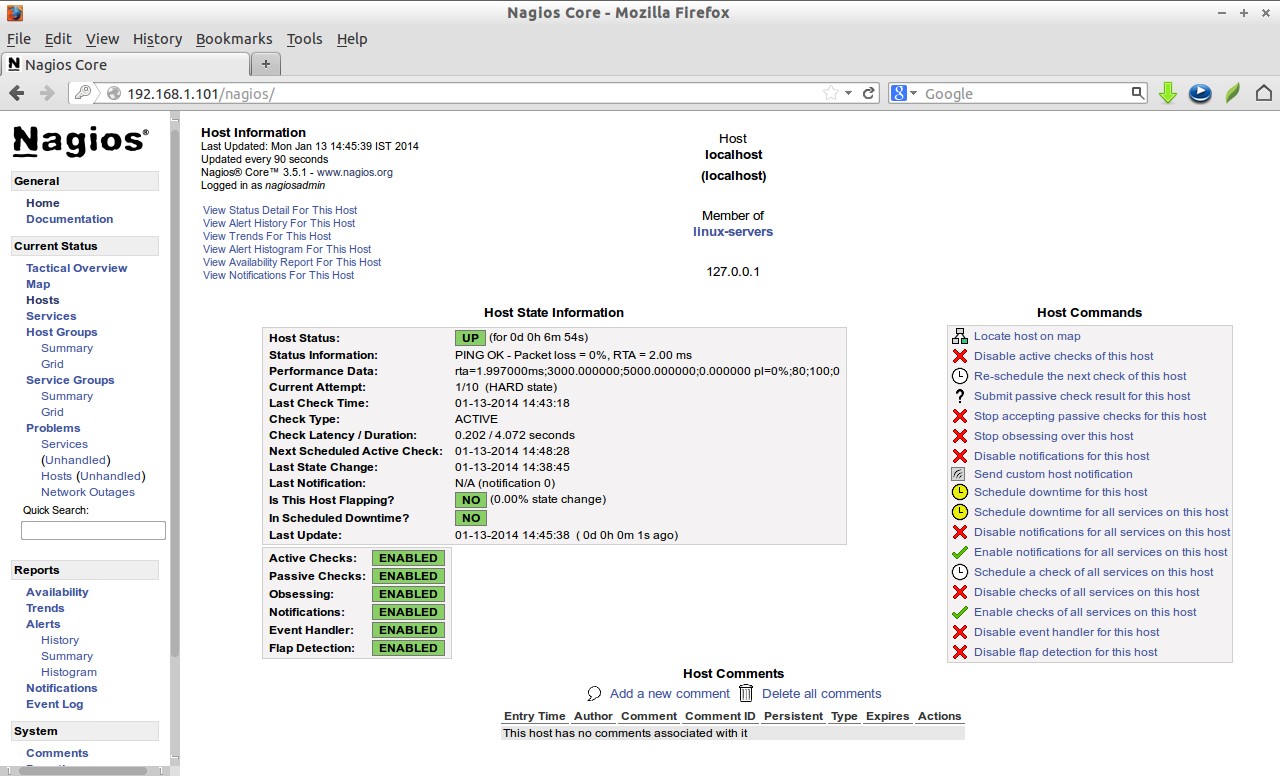
Add Monitoring targets to Nagios server
Now let us add some clients to monitor by Nagios server. To do that we have to install nrpe and nagios-plugins in our monitoring targets.
On CentOS/RHEL/Scientifc Linux clients:
Like i said before, you have to add EPEL repository in your CentOS/RHEL/Scientific Linux 6.x clients to install nrpe package.
Install “nrpe” and “nagios-plugins” packages in client systems to be monitored.
# yum install nrpe nagios-plugins-all opensslOn Debian/Ubuntu clients:
$ sudo apt-get install nagios-nrpe-server nagios-pluginsConfigure Monitoring targets
Edit /etc/nagios/nrpe.cfg file,
# vi /etc/nagios/nrpe.cfgAdd your Nagios server ip address
[...]
## Line 81 - Add the Nagios server IP ##
allowed_hosts=127.0.0.1 192.168.1.101
[...]
Start nrpe service:
# service nrpe start
# chkconfig nrpe on
For Debian/Ubuntu Clients, start nrpe service as shown below.
$ sudo /etc/init.d/nagios-nrpe-server restart
Now go back to your Nagios server to add the clients to be monitored through nagios server. Edit “/etc/nagios/nagios.cfg” file,
# vi /etc/nagios/nagios.cfg
and uncomment the following lines.
## Line 52 - Uncomment ##
cfg_dir=/etc/nagios/servers
Create a directory called “servers” under “/etc/nagios/”.
# mkdir /etc/nagios/servers
Create config file to the client to be monitored:
# vi /etc/nagios/servers/clients.cfg
define host{

use                             linux-server

host_name                       client

alias                           client

address                         192.168.1.100

max_check_attempts              5

check_period                    24x7

notification_interval           30

notification_period             24x7

}
Finally restart nagios service.
# service nagios restart
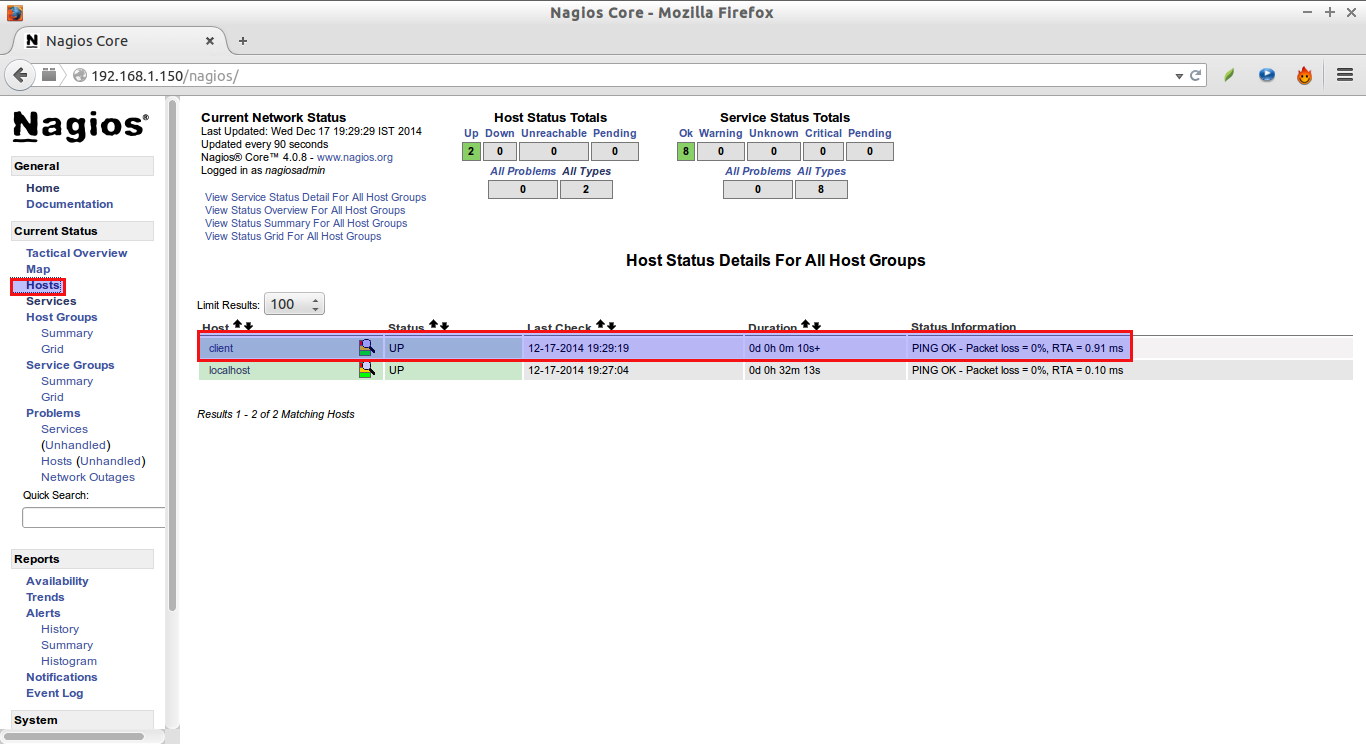
Now open the nagios admin console in the browser and navigate to “Hosts”
section in the left pane. You will see the newly added client will be
visible there. Click on the host to see if there is anything wrong or
alerts.
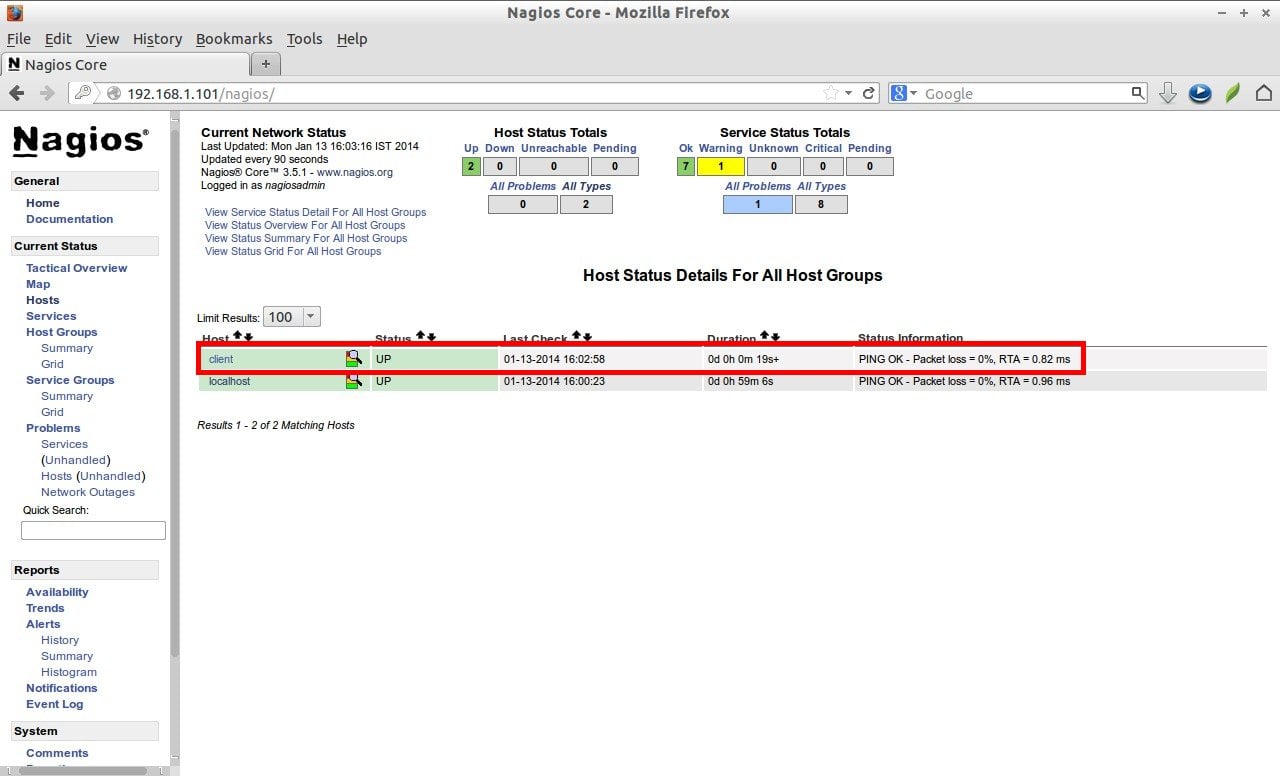 Click on the monitoring target, you’ll get the detailed output:
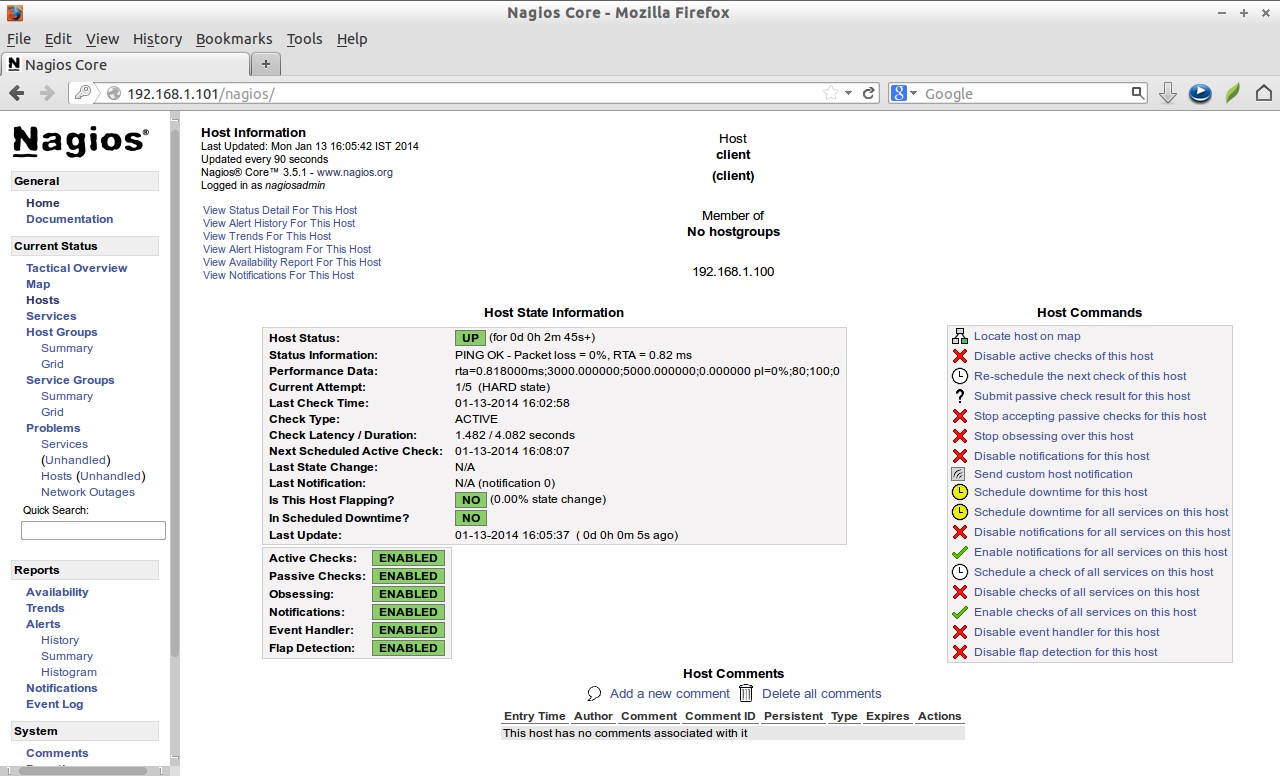 Like this way, you can define more clients by creating a separate config files “/etc/nagios/servers directory for each client.
Define services
We did define the monitoring host before. Now let us add some services of the monitoring host. For example to monitor the ssh service, add the following lines shown in red colour in the /etc/nagios/servers/clients.cfg file.
# vi /etc/nagios/servers/clients.cfg
define host{

use                             linux-server

host_name                       client

alias                           client

address                         192.168.1.100

max_check_attempts              5

check_period                    24x7

notification_interval           30

notification_period             24x7

}

define service {
        use                             generic-service
        host_name                       client
        service_description             SSH
        check_command                   check_ssh
        notifications_enabled           0
        }
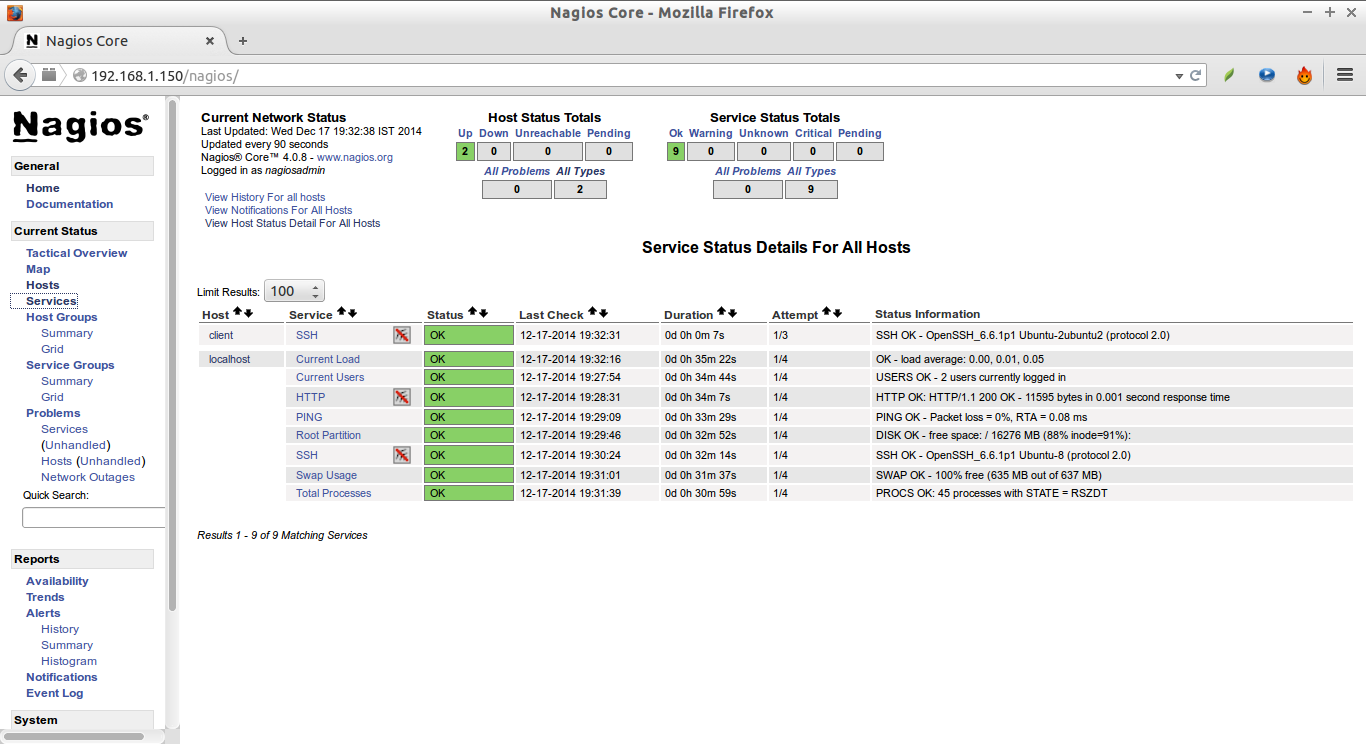
Save and close the file. Restart Nagios.# service nagios restartNow log in to Nagios web console and check for the added services. Navigate to Services section, you’ll see the ssh service there.
 To know more about object definitions such as Host definitions, service definitions, contact definitions and more please do visit here. This page will describe you the description and format of all object definitions.
That’s all about now. Good Luck! Stay healthy!
**********************************************************
Install And Configure Nagios 4 On CentOS 7
Introduction
Nagios
is an open source software that can be used for network and
infrastructure monitoring. Nagios will monitor servers, switches,
applications and services. It alerts the System Administrator when
something went wrong and also alerts back when the issues has been
rectified.
Features
- Monitor your entire IT infrastructure;
- Identify problems before they occur;
- Know immediately when problems arise;
- Share availability data with stakeholders.hypothetical question;
- Detect security breaches;
- Plan and budget for IT upgrades;
- Reduce downtime and business losses.
Scenario
In this tutorial i am going to use two systems as mentioned below.
Nagios server:
Operating system : CentOS 7 minimal server
IP Address       : 192.168.1.150/24
Nagios client:
Operating System : CentOS 7 minimal server
IP Address       : 192.168.1.152/24
Prerequisites
Before
installing Nagios, make sure that you’ve a properly installed and
configured LAMP stack in your server. To install and configure LAMP
server, refer the following link.
Also install the following prerequisites too. All commands should be run as root user.
yum install gd gd-devel gcc glibc glibc-common wget
Create Nagios User And Group
Create a new nagios user account and give it a password:useradd -m nagios passwd nagiosCreate a new nagcmd group for allowing external commands to be submitted through the web interface. Add both the nagios user and the apache user to the group.
groupadd nagcmd
usermod -a -G nagcmd nagios
usermod -a -G nagcmd apache
Download Nagios And Plugins
Go to the nagios download page, and get the latest version. As of writing this, the latest version was 4.0.8.wget http://prdownloads.sourceforge.net/sourceforge/nagios/nagios-4.0.8.tar.gzAnd, download nagios plugins too.
wget http://nagios-plugins.org/download/nagios-plugins-2.0.3.tar.gz
Install Nagios And Plugins
Install nagios:
I
tested this how-to on CentOS 7 minimal server, although it should work
on all RHEL 7 and its clones like Scientific Linux 7 too.
Go to the folder where you’ve downloaded nagios, and extract it using command:tar xzf nagios-4.0.8.tar.gzChange to the nagios directory, and run the following commands one by one from the Terminal to compile and install nagios.
cd nagios-4.0.8
./configure --with-command-group=nagcmd
make all
make install
make install-init
make install-config
make install-commandmode
Install Nagios Web interface:
Enter the following commands to compile and install nagios web interface.
make install-webconfCreate a nagiosadmin account for logging into the Nagios web interface. Remember the password you assign to this account. You’ll need it while logging in to nagios web interface..
htpasswd -c /usr/local/nagios/etc/htpasswd.users nagiosadminRestart Apache to make the new settings take effect.
systemctl restart httpd
Install Nagios plugins:
Go to the directory where you downloaded the nagios plugins, and extract it.tar xzf nagios-plugins-2.0.3.tar.gzChange to the nagios plugins directory:
cd nagios-plugins-2.0.3Run the following commands one by one to compile and install it.
./configure --with-nagios-user=nagios --with-nagios-group=nagios
make
make installWe aren’t finished yet.
Configure Nagios
Nagios sample configuration files have now been installed in the /usr/local/nagios/etc directory. These sample files should work fine for getting started with Nagios. However, you’ll need to put your actual email ID to receive alerts.To do that, Edit the /usr/local/nagios/etc/objects/contacts.cfg config file with your favorite editor and change the email address associated with the nagiosadmin contact definition to the address you’d like to use for receiving alerts.
vi /usr/local/nagios/etc/objects/contacts.cfgFind the following line and enter the email id:
[...]
define contact{
        contact_name                    nagiosadmin             ; Short name of user
        use                             generic-contact         ; Inherit default values from generic-contact template (defined above)
        alias                           Nagios Admin            ; Full name of user

        email                           sk@unixmen.com  ; <<***** CHANGE THIS TO YOUR EMAIL ADDRESS ******
        }
[...]
Save and close the file.
Then, Edit file /etc/httpd/conf.d/nagios.conf,
vi /etc/httpd/conf.d/nagios.conf
And
edit the following lines if you want to access nagios administrative
console from a particular IP series. Here, I want to allow nagios
administrative access from 192.168.1.0/24 series only.
[...]
## Comment the following lines ##
#   Order allow,deny
#   Allow from all

## Uncomment and Change lines as shown below ##
Order deny,allow
Deny from all
Allow from 127.0.0.1 192.168.1.0/24
[...]
Restart httpd service:
systemctl restart httpd
Now, check for any configuration errors using command:
/usr/local/nagios/bin/nagios -v /usr/local/nagios/etc/nagios.cfg
If there are no errors, start nagios service and make it to start automatically on every boot.
systemctl start nagios
chkconfig --add nagios
chkconfig nagios on
Adjust SELinux Settings
By default, SELinux will be in enforcing mode, and it throws “Internal Server Error” messages when you attempt to access the Nagios CGIs.To rectify this error, edit file /etc/selinux/config:
vi /etc/selinux/configAnd, set SELinux to permissive mode.
[...
SELINUX=permissive
[...]
Reboot your server to take effects the changes.
Access Nagios Web Interface
Open nagios administrator console with URL http://nagios-server-ip/nagios and enter the username as nagiosadmin and its password which we created in the earlier steps.
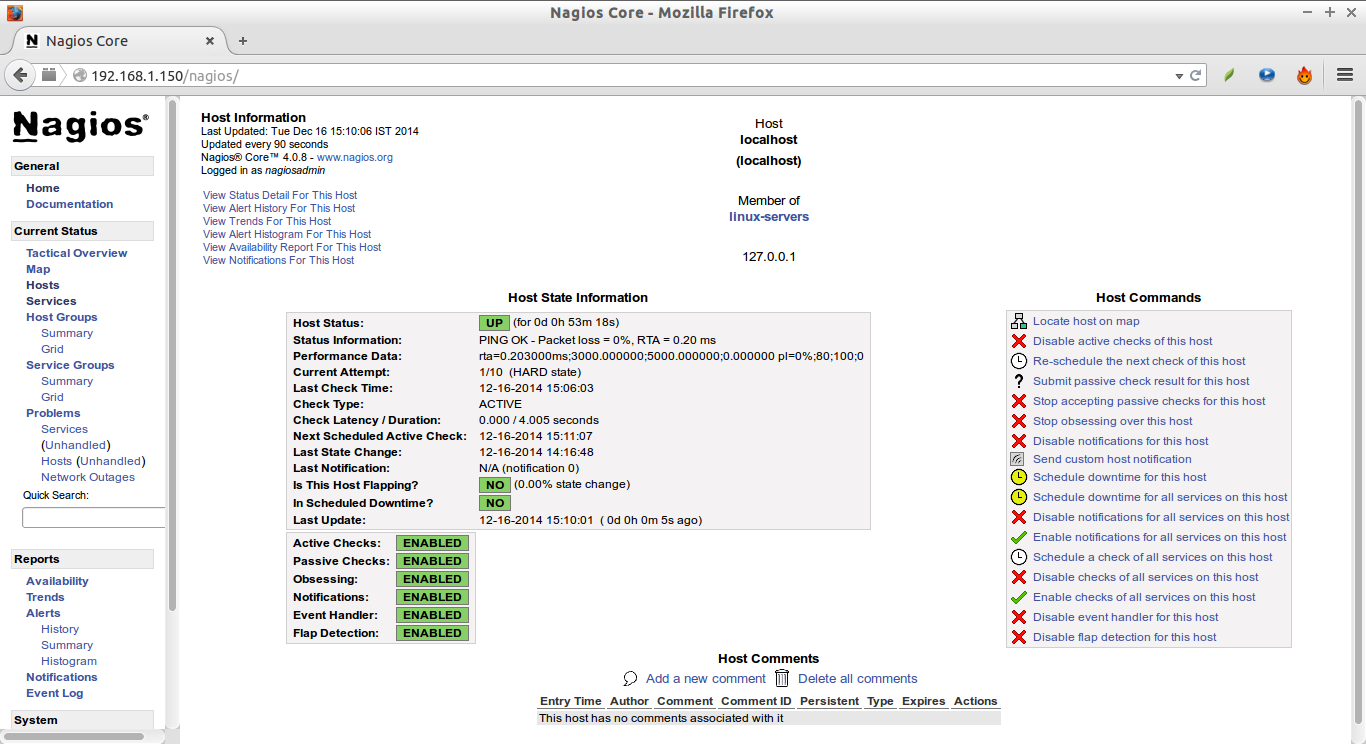
This is how Nagios administrative console looks:
Click on the “Hosts”
section in the left pane of the console. You will see there the no of
hosts to be monitored by Nagios server. We haven’t added any hosts yet.
So it simply monitors the localhost itself only.
Click on the particular host to display more details:
Add Monitoring targets to Nagios server
Now, let us add some clients to monitor by Nagios server. To do that we have to install nrpe and nagios-plugins in our monitoring targets.
On CentOS/RHEL/Scientifc Linux clients:
Add EPEL repository in your CentOS/RHEL/Scientific Linux 6.x or 7 clients to install nrpe package.
To install EPEL on CentOS 7, run the following command:
yum install epel-release
On CentOS 6.x systems, refer the following link.
Install “nrpe” and “nagios-plugins” packages in client systems:
yum install nrpe nagios-plugins-all openssl
On Debian/Ubuntu clients:
sudo apt-get install nagios-nrpe-server nagios-plugins
Configure Monitoring targets
Edit /etc/nagios/nrpe.cfg file,
sudo vi /etc/nagios/nrpe.cfg
Add your Nagios server ip address:
[...]
## Find the following line and add the Nagios server IP ##
allowed_hosts=127.0.0.1 192.168.1.150
[...]
Start nrpe service on CentOS clients:
CentOS 7:
systemctl start nrpe
chkconfig nrpe on
CentOS 6.x:
service nrpe start
chkconfig nrpe on
For Debian/Ubuntu Clients, start nrpe service as shown below:
sudo /etc/init.d/nagios-nrpe-server restart
Now, go back to your Nagios server, and add the clients in the configuration file.
To do that, Edit “/usr/local/nagios/etc/nagios.cfg” file,
vi /usr/local/nagios/etc/nagios.cfg
and uncomment the following lines.
## Find and uncomment the following line ##
cfg_dir=/usr/local/nagios/etc/servers
Create a directory called “servers” under “/usr/local/nagios/etc/”.
mkdir /usr/local/nagios/etc/servers
Create config file to the client to be monitored:
vi /usr/local/nagios/etc/servers/clients.cfg
Add the following lines:
define host{

use                             linux-server

host_name                       client

alias                           client

address                         192.168.1.152

max_check_attempts              5

check_period                    24x7

notification_interval           30

notification_period             24x7

}
Here, 192.168.1.152 is my nagios client IP address. Finally restart nagios service.
systemctl restart nagios
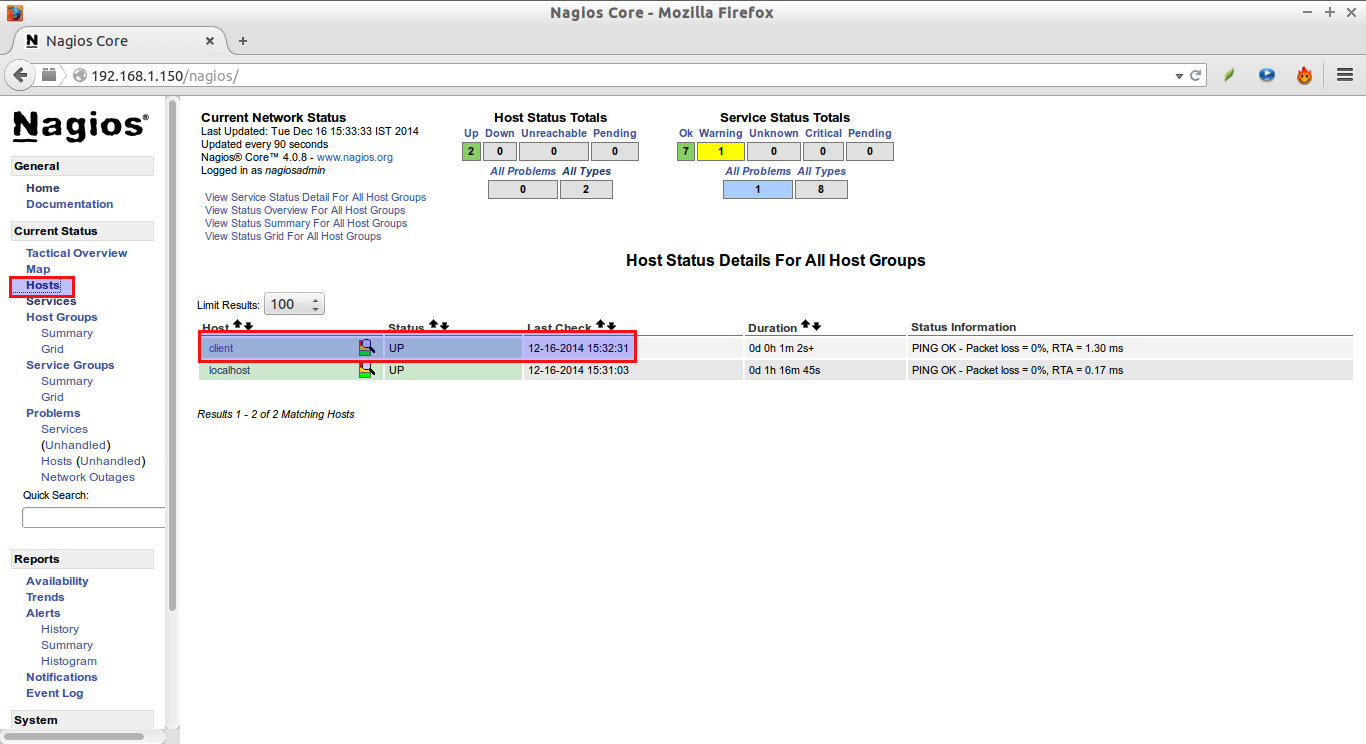
Wait for few seconds, and refresh nagios admin console in the browser and navigate to “Hosts”
section in the left pane. You will see the newly added client will be
visible there. Click on the host to see if there is anything wrong or
any alerts it has.
Click on the monitoring target (client) to view the detailed output:
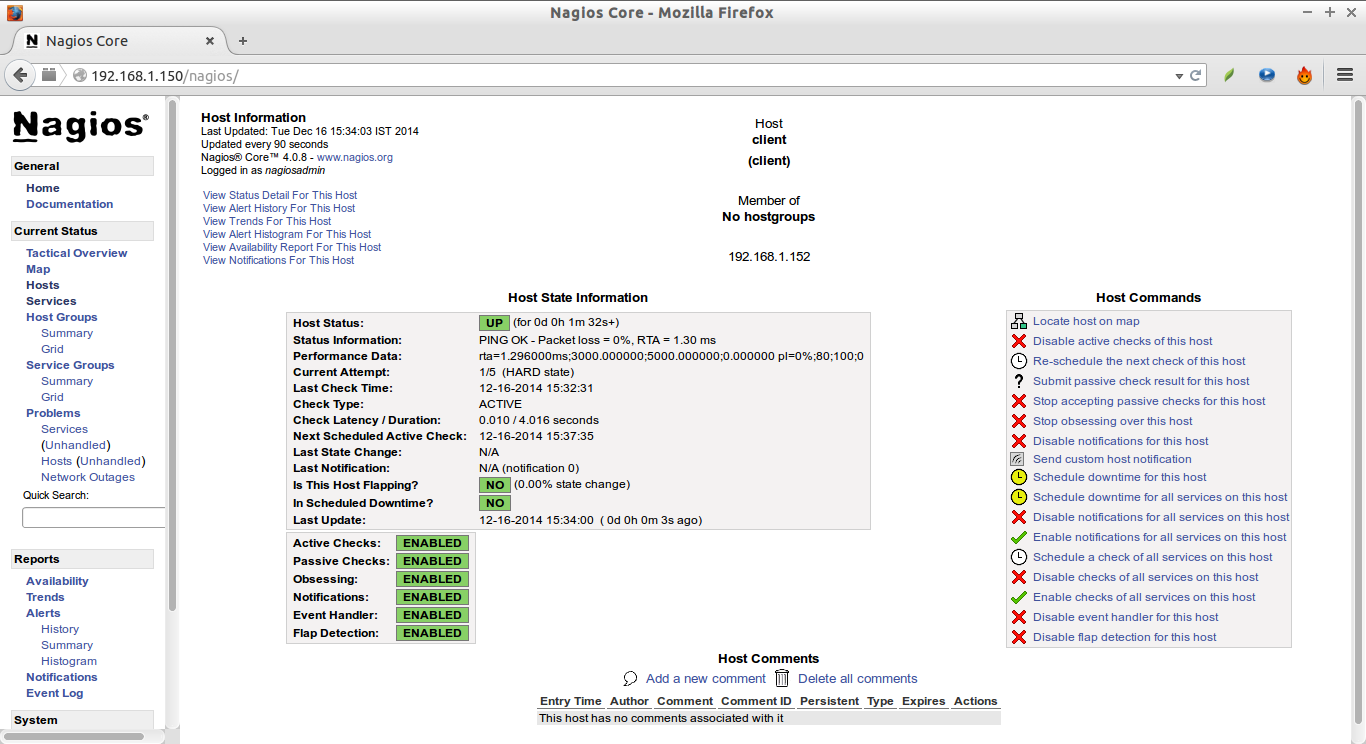
Similarly, you can define more clients by creating a separate config files “/usr/local/nagios/etc/servers” directory for each client.
Define services
We have just defined the monitoring host. Now, let us add some services of the monitoring host. For example, to monitor the ssh service, add the following lines shown in bold in the “/usr/local/nagios/etc/servers/clients.cfg” file.
vi /usr/local/nagios/etc/servers/clients.cfg
Add the following lines shown in bold:
define host{

use                             linux-server

host_name                       client

alias                           client

address                         192.168.1.152

max_check_attempts              5

check_period                    24x7

notification_interval           30

notification_period             24x7

}

define service {
        use                             generic-service
        host_name                       client
        service_description             SSH
        check_command                   check_ssh
        notifications_enabled           0
        }
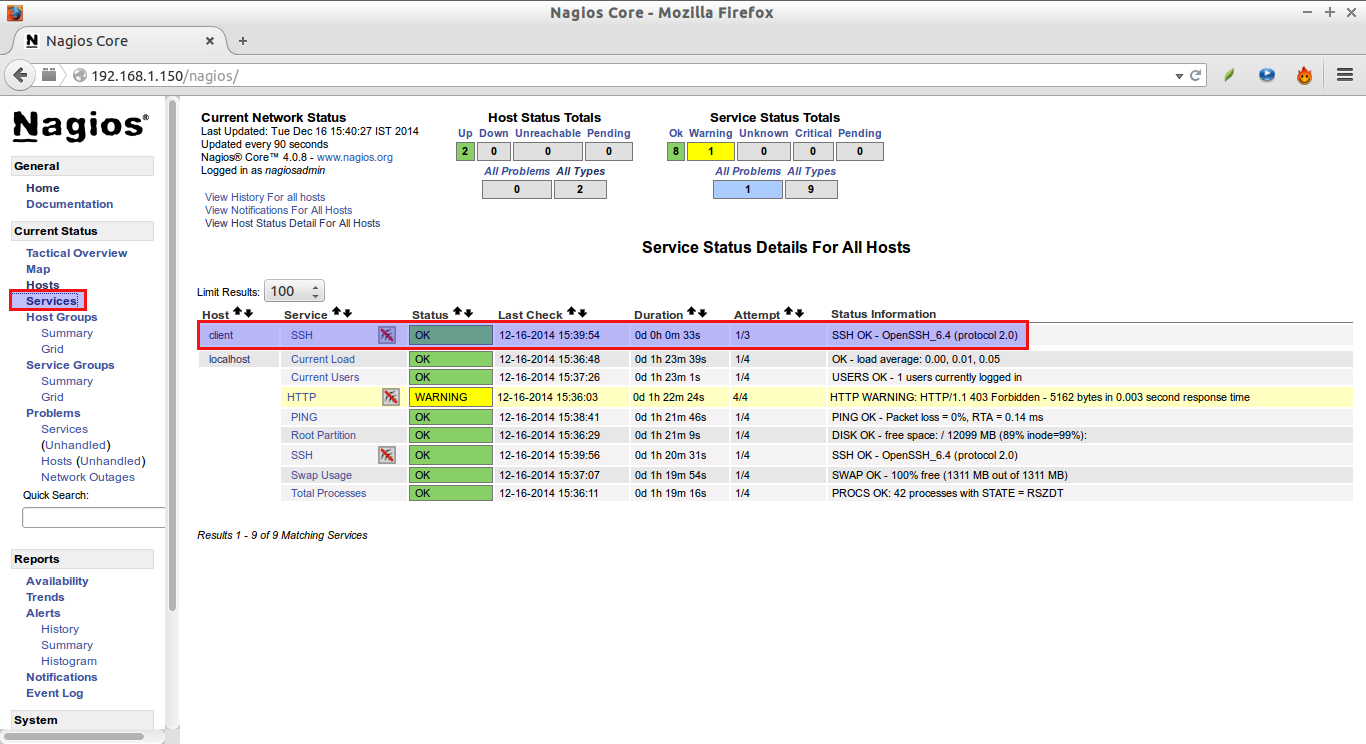
Save and close the file. Restart Nagios.
systemctl restart nagios
Wait for few seconds, and check for the added services (i.e ssh) in the nagios web interface. Navigate to Services section on the left side bar, you’ll see the ssh service there.
To know more about object definitions such as Host definitions, service definitions, contact definitions, please do visit here. This page will explain you the description and format of all object definitions.
Thats it. Cheers!
*****************************************************
Install And Configure Nagios 4 On Ubuntu 14.10/14.04
Nagios is an open source
software that can be used for network and infrastructure monitoring.
Nagios will monitor servers, switches, applications and services. It
alerts the System Administrator when something goes wrong and also
alerts back when the issues has been rectified.
Using Nagios, you can:
- Monitor your entire IT infrastructure.
- Identify problems before they occur.
- Know immediately when problems arise.
- Share availability data with stakeholders.
- Detect security breaches.
- Plan and budget for IT upgrades.
- Reduce downtime and business losses.
Scenario
In this tutorial i am going to use two systems as mentioned below.
Nagios server:
Operating system : Ubuntu 14.10 Server
IP Address       : 192.168.1.150/24
Nagios client:
Operating System : Ubuntu 14.04 Server
IP Address       : 192.168.1.250/24
Prerequisites
Make sure your server have installed with fully working LAMP stack. If not, follow the below link to install LAMP server.
And, install the following prerequisites too:
sudo apt-get install build-essential libgd2-xpm-dev apache2-utils
Create Nagios User And Group
Create a new nagios user account and give it a password:
sudo useradd -m nagios
sudo passwd nagios
Create a new nagcmd
group for allowing external commands to be submitted through the web
interface. Add both the nagios user and the apache user to the group.
sudo groupadd nagcmd
sudo usermod -a -G nagcmd nagios
sudo usermod -a -G nagcmd www-data
Download Nagios And Plugins
Go to the nagios download page, and get the latest version. As of writing this, the latest version was 4.0.8.
wget http://prdownloads.sourceforge.net/sourceforge/nagios/nagios-4.0.8.tar.gz
And, download nagios plugins too.
wget http://nagios-plugins.org/download/nagios-plugins-2.0.3.tar.gz
Install Nagios And Plugins
Install nagios:
Go to the folder where you’ve downloaded nagios, and extract it using command:
tar xzf nagios-4.0.8.tar.gz
Change to the nagios directory, and run the following commands one by one from the Terminal to compile and install nagios.
cd nagios-4.0.8
sudo ./configure --with-command-group=nagcmd
sudo make all
sudo make install
sudo make install-init
sudo make install-config
sudo make install-commandmode
Install Nagios Web interface:
Enter the following commands to compile and install nagios web interface.
sudo make install-webconf
You may get the following error:
/usr/bin/install -c -m 644 sample-config/httpd.conf /etc/httpd/conf.d/nagios.conf
 /usr/bin/install: cannot create regular file ‘/etc/httpd/conf.d/nagios.conf’: No such file or directory
 Makefile:296: recipe for target 'install-webconf' failed
 make: *** [install-webconf] Error 1
The above error message describes that nagios is trying to create the nagios.conf file inside the /etc/httpd.conf/ directory. But, in Ubuntu systems the nagios.conf file should be placed in /etc/apache2/sites-enabled/ directory.
So, run the following command instead of using sudo make install-webconf.
sudo /usr/bin/install -c -m 644 sample-config/httpd.conf /etc/apache2/sites-enabled/nagios.conf
Check if nagios.conf is placed in /etc/apache2/sites-enabled directory.
sudo ls -l /etc/apache2/sites-enabled/
Sample output:
total 4
lrwxrwxrwx 1 root root  35 Dec 17 17:59 000-default.conf -> ../sites-available/000-default.conf
-rw-r--r-- 1 root root 982 Dec 17 19:01 nagios.conf
Create a nagiosadmin
account for logging into the Nagios web interface. Remember the
password you assign to this account. You’ll need it while logging in to
nagios web interface..
sudo htpasswd -c /usr/local/nagios/etc/htpasswd.users nagiosadmin
Restart Apache to make the new settings take effect.
sudo service apache2 restart
Install Nagios plugins:
Go to the directory where you downloaded the nagios plugins, and extract it.
tar xzf nagios-plugins-2.0.3.tar.gz
Change to the nagios plugins directory:
cd nagios-plugins-2.0.3
Run the following commands one by one to compile and install it.
sudo ./configure --with-nagios-user=nagios --with-nagios-group=nagios
sudo make
sudo make install
We aren’t finished yet.
Configure Nagios
Nagios sample configuration files have now been installed in the /usr/local/nagios/etc
directory. These sample files should work fine for getting started with
Nagios. However, you’ll need to put your actual email ID to receive
alerts.
To do that, Edit the /usr/local/nagios/etc/objects/contacts.cfg config file with your favorite editor and change the email address associated with the nagiosadmin contact definition to the address you’d like to use for receiving alerts.
sudo nano /usr/local/nagios/etc/objects/contacts.cfg
Find the following line and enter the email id:
[...]
define contact{
        contact_name                    nagiosadmin             ; Short name of user
        use                             generic-contact         ; Inherit default values from generic-contact template (defined above)
        alias                           Nagios Admin            ; Full name of user

        email                           sk@unixmen.com  ; <<***** CHANGE THIS TO YOUR EMAIL ADDRESS ******
        }
[...]
Save and close the file.
Then, Edit file /etc/apache2/sites-enabled/nagios.conf,
sudo nano /etc/apache2/sites-enabled/nagios.conf
And
edit the following lines if you want to access nagios administrative
console from a particular IP series. Here, I want to allow nagios
administrative access from 192.168.1.0/24 series only.
[...]
## Comment the following lines ##
#   Order allow,deny
#   Allow from all

## Uncomment and Change lines as shown below ##
Order deny,allow
Deny from all
Allow from 127.0.0.1 192.168.1.0/24
[...]
Enable Apache’s rewrite and cgi modules:
sudo a2enmod rewrite
sudo a2enmod cgi
Restart apache service.
sudo service apache2 restart
Check nagios,conf file for any syntax errors:
sudo /usr/local/nagios/bin/nagios -v /usr/local/nagios/etc/nagios.cfg
If there are no errors, start nagios service and make it to start automatically on every boot.
sudo service nagios start
sudo ln -s /etc/init.d/nagios /etc/rcS.d/S99nagios
Access Nagios Web Interface
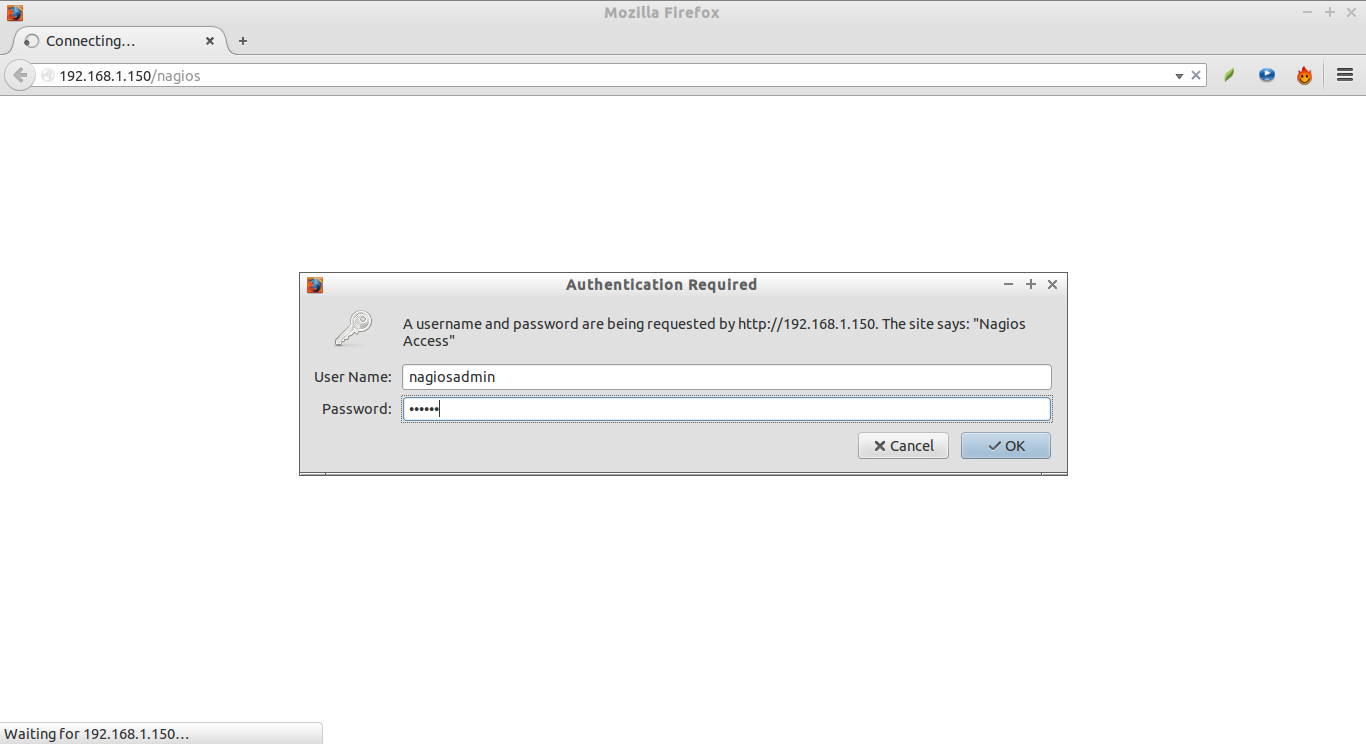
Open nagios administrator console with URL http://nagios-server-ip/nagios and enter the username as nagiosadmin and its password which we created in the earlier steps.

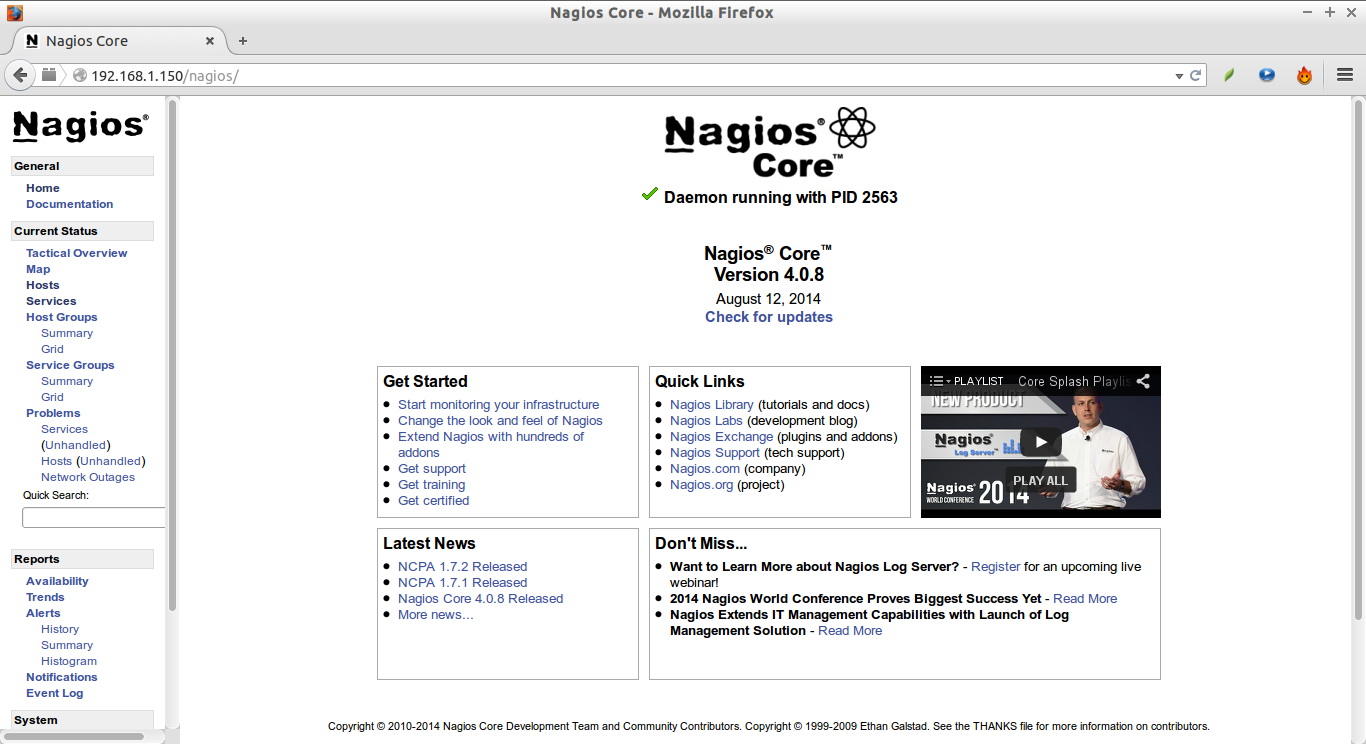
This is how Nagios administrative console looks:

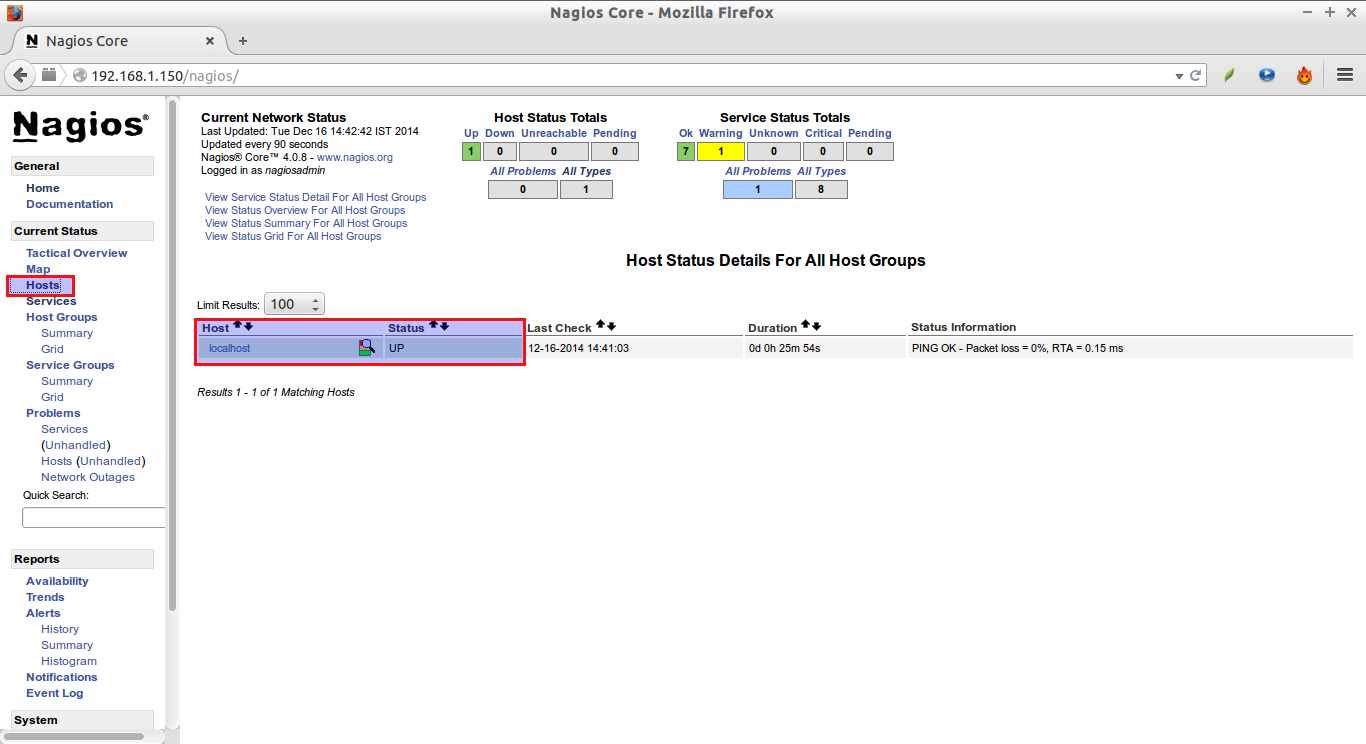
Click on the “Hosts”
section in the left pane of the console. You will see there the no of
hosts to be monitored by Nagios server. We haven’t added any hosts yet.
So it simply monitors the localhost itself only.
Click on the particular host to display more details:

Add Monitoring targets to Nagios server
Now, let us add some clients to monitor by Nagios server. To do that we have to install nrpe and nagios-plugins in our monitoring targets.
On CentOS/RHEL/Scientifc Linux clients:
Add EPEL repository in your CentOS/RHEL/Scientific Linux 6.x or 7 clients to install nrpe package.
To install EPEL on CentOS 7, run the following command:
yum install epel-release
On CentOS 6.x systems, refer the following link.
Install “nrpe” and “nagios-plugins” packages in client systems:
yum install nrpe nagios-plugins-all openssl
On Debian/Ubuntu clients:
sudo apt-get install nagios-nrpe-server nagios-plugins
Configure Monitoring targets
Edit /etc/nagios/nrpe.cfg file,
sudo nano /etc/nagios/nrpe.cfg
Add your Nagios server ip address:
[...]
## Find the following line and add the Nagios server IP ##
allowed_hosts=127.0.0.1 192.168.1.150
[...]
Start nrpe service on CentOS clients:
CentOS 7:
systemctl start nrpe
chkconfig nrpe on
CentOS 6.x:
service nrpe start
chkconfig nrpe on
For Debian/Ubuntu Clients, start nrpe service as shown below:
sudo /etc/init.d/nagios-nrpe-server restart
Now, go back to your Nagios server, and add the clients in the configuration file.
To do that, Edit “/usr/local/nagios/etc/nagios.cfg” file,
sudo nano /usr/local/nagios/etc/nagios.cfg
and uncomment the following lines.
## Find and uncomment the following line ##
cfg_dir=/usr/local/nagios/etc/servers
Create a directory called “servers” under “/usr/local/nagios/etc/”.
sudo mkdir /usr/local/nagios/etc/servers
Create config file to the client to be monitored:
sudo nano /usr/local/nagios/etc/servers/clients.cfg
Add the following lines:
define host{

use                             linux-server

host_name                       client

alias                           client

address                         192.168.1.250

max_check_attempts              5

check_period                    24x7

notification_interval           30

notification_period             24x7

}
Here, 192.168.1.250 is my nagios client IP address. Finally restart nagios service.
sudo service nagios restart
Wait for few seconds, and refresh nagios admin console in the browser and navigate to “Hosts”
section in the left pane. You will see the newly added client will be
visible there. Click on the host to see if there is anything wrong or
any alerts it has.
Click on the monitoring target (client) to view the detailed output:

Similarly, you can define more clients by creating a separate config files “/usr/local/nagios/etc/servers” directory for each client.
Define services
We have just defined the monitoring host. Now, let us add some services of the monitoring host. For example, to monitor the ssh service, add the following lines shown in bold in the “/usr/local/nagios/etc/servers/clients.cfg” file.
sudo nano /usr/local/nagios/etc/servers/clients.cfg
Add the following lines shown in bold:
define host{

use                             linux-server

host_name                       client

alias                           client

address                         192.168.1.250

max_check_attempts              5

check_period                    24x7

notification_interval           30

notification_period             24x7

}

define service {
        use                             generic-service
        host_name                       client
        service_description             SSH
        check_command                   check_ssh
        notifications_enabled           0
        }
Save and close the file. Restart Nagios.
sudo service nagios restart
Wait for few seconds, and check for the added services (i.e ssh) in the nagios web interface. Navigate to Services section on the left side bar, you’ll see the ssh service there.
To know more about object definitions such as Host definitions, service definitions, contact definitions, please do visit here. This page will explain you the description and format of all object definitions.
Additional Tip:
If you’re trying to use check_http with the -S flag (for https), this guide misses a big step.
Make sure you install openssl and libssl-dev first. And yes, even if your Nagios server is checking a remote client, you need openssl and libssl-dev locally.
The when you get to configuring the Nagios plugins, add –with-openssl so you end up with:
./configure --with-nagios-user=nagios --with-nagios-group=nagios --with-openssl
I would like to thank our Unixmen reader for this useful tip.
That’s it. Cheers!
*-****************************************************
Installing and Configuring NRPE On The Remote Linux Machine
In this article we will show you how to install and configure NRPE
AGENT in the remote server and how to add the host to Nagios Core.
Download the Linux NRPE agent to the /tmp directory on the Linux server you wish to monitor.
cd /tmp
For RHEL/CentOS 5+, Fedora 14+, SLES 11+, OpenSUSE 11+, Ubuntu 12+, and Debian 6+:
wget http://assets.nagios.com/downloads/nagiosxi/agents/linux-nrpe-agent.tar.gz
For RHEL 4 & CentOS 4 (el4):
wget http://assets.nagios.com/downloads/nagiosxi/agents/linux-nrpe-agent-el4.tar.gz
Unpack the installation archive you just downloaded:
tar xzf linux-nrpe-agent.tar.gz
Enter the newly created agent sub-directory:
cd linux-nrpe-agent
You need to run the wrapper script as root (if using Ubuntu you’ll need to either run sudo -i to run as root):
sudo ./fullinstall
The script will stop to prompt you once, to ask for the IP address(es) for your monitoring server(s).
You
will need to type the ip address, of your Nagios server and then press
enter. This will allow connections from your monitoring server to the
agent process.

They are listed here.
command[check_users]=/usr/local/nagios/libexec/check_users w 5 c 10 command[check_load]=/usr/local/nagios/libexec/check_load w 15,10,5 c 30,25,20 command[check_hda1]=/usr/local/nagios/libexec/check_disk w 20 c 10 p /dev/hda1 command[check_zombie_procs]=/usr/local/nagios/libexec/check_procs w 5 c 10 s Z command[check_total_procs]=/usr/local/nagios/libexec/check_procs w 150 c 200In order to add additional commands you will need to construct them in the same format and add them to this file. If any changes are made the xinetd daemon must be restarted.
Configuring Nagios Core to Monitor the Linux Host
You have now successfully installed and configured the monitoring agent and required plugins on the Linux server. In order to monitor the server using Nagios Core, you will need to add the host and services to nagios server from the command line.Now login into your Nagios Server from the command line you will need to do following steps:
- Install NRPE Plugin
- Add the Linux Server to the host file
- Configure Services
Download latest NRPE Plugin with wget command.
cd /tmp
wget http://sourceforge.net/projects/nagios/files/nrpe-2.x/nrpe-2.15/nrpe-2.15.tar.gz
Then extract the NRPE source.
tar xzf nrpe-2.15.tar.gz
cd nrpe-2.15
Compile and install the NRPE addon.
./configure
make all
make install-daemon
Now make sure your nagios is able to connect nrpe client on remote Linux system. Try to execute following command. In this example 192.168.5.178 is the ip address of the remote host.
# /usr/local/nagios/libexec/check_nrpe -H 192.168.5.178
NRPE v2.15
If you see output that is similar it is functioning correctly.
Then add host entry for each remote box you will monitor. This example is using the linuxserver template, be sure to
check that template out to verify the settings are the ones you want to use.
Edit the hosts.cfg file and add the default host template name and define remote hosts as shown below
nano /usr/local/nagios/etc/hosts.cfg
define host{
use linuxserver
host_name class
alias Base
address 192.168.5.178
}
The last step is the configure services. Each service you
want to monitor on the remote host must be entered individually.The
check_nrpe command is used to access the remote server and then execute
the Nagios plugin that is on the remote server and retrieve the
information.Now open services.cfg file add the following services to be monitored.
define service{
        use                     generic-service
        host_name               class
        service_description     CPU Load
        check_command           check_nrpe!check_load
        }

define service{
        use                     generic-service
        host_name               class
        service_description     Total Processes
        check_command           check_nrpe!check_total_procs
        }

define service{
        use                     generic-service
        host_name               class
        service_description     Users Load
        check_command           check_nrpe!check_users
        }

define service{
        use                     generic-service
        host_name               class
        service_description     Check Zombies
        check_command           check_nrpe!check_zombie_procs
        }

define service{
        use                     generic-service
        host_name               class
        service_description     Check hda1
        check_command           check_nrpe!check_hda1
        }
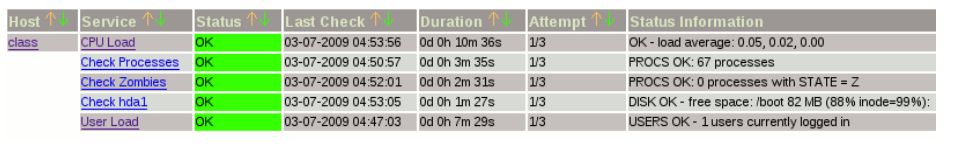
Next, verify Nagios Configuration files for any errors./usr/local/nagios/bin/nagios -v /usr/local/nagios/etc/nagios.cfg Total Warnings: 0 Total Errors: 0Finally, restart Nagios.
service nagios restartLog into the web interface via : http://[SERVER_IP]/nagios , enter your login information and check for new Linux hosts added in nagios core service.
That’s all.
Congratulations! Enjoy your Monitoring platform Nagios Core.
No comments:
Post a Comment